

SITCOMTN-131
Monitor coupling in M1M3 VMS system and TMA drives together#
Abstract
In this technote we investigate the coupling between M1M3 and Telescope Mount Assembly (TMA) using the Vibration Monitor System (VMS) data. There are two parts in the technote. The first one is a general study where we analyse the vibrations recorded by the VMS during various slews in elevation and azimuth. We also analyze the VMS data when the TMA is in tracking mode.
In the second part, we perform a detailed investigation of a peculiar event occuring on June 28th, 2023 around 1:08 am where a strong noise were reported during and after an elevation slew.
Associated JIRA ticket: SITCOM-784
The M1M3 Vibration Monitor System (VMS)#
The M1M3 cell is equipped with 3 accelerometers measuring accelerations along 3 axes (x, y and z) that all together are composing the M1M3 Vibration Monitor System or VMS. The following figure shows the location of the 3 accelerometers on the mirror cell.
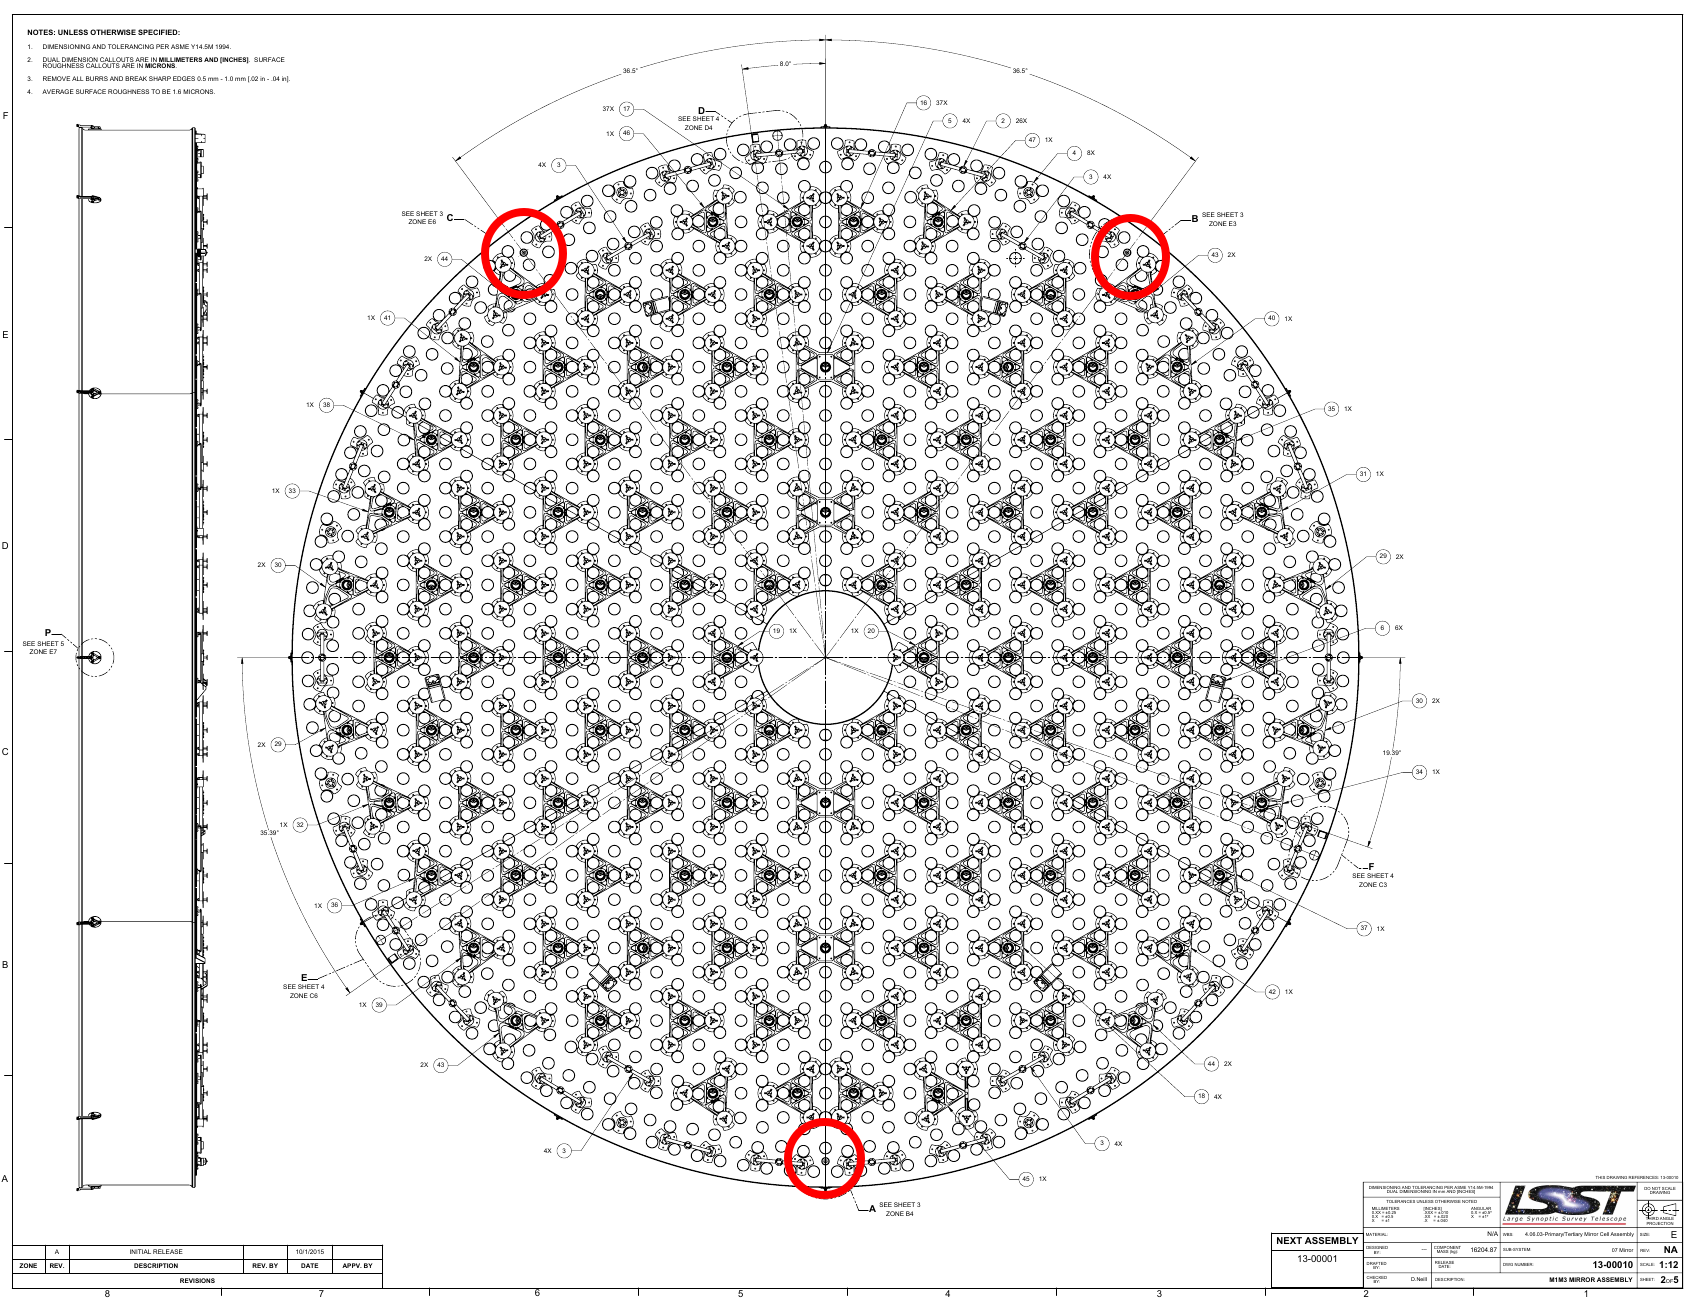
Fig. 1 Location of the VMS accelerometers on the mirror cell (red circles)#
The next figure shows the mount details of the 3 VMS accelerometers on the mirror cell. We can see that they are rotated in such a way that their x, y and z axes are oriented in the same way. The 3 accelerometers are measuring the same thing on 3 different locations of the mirror cell.
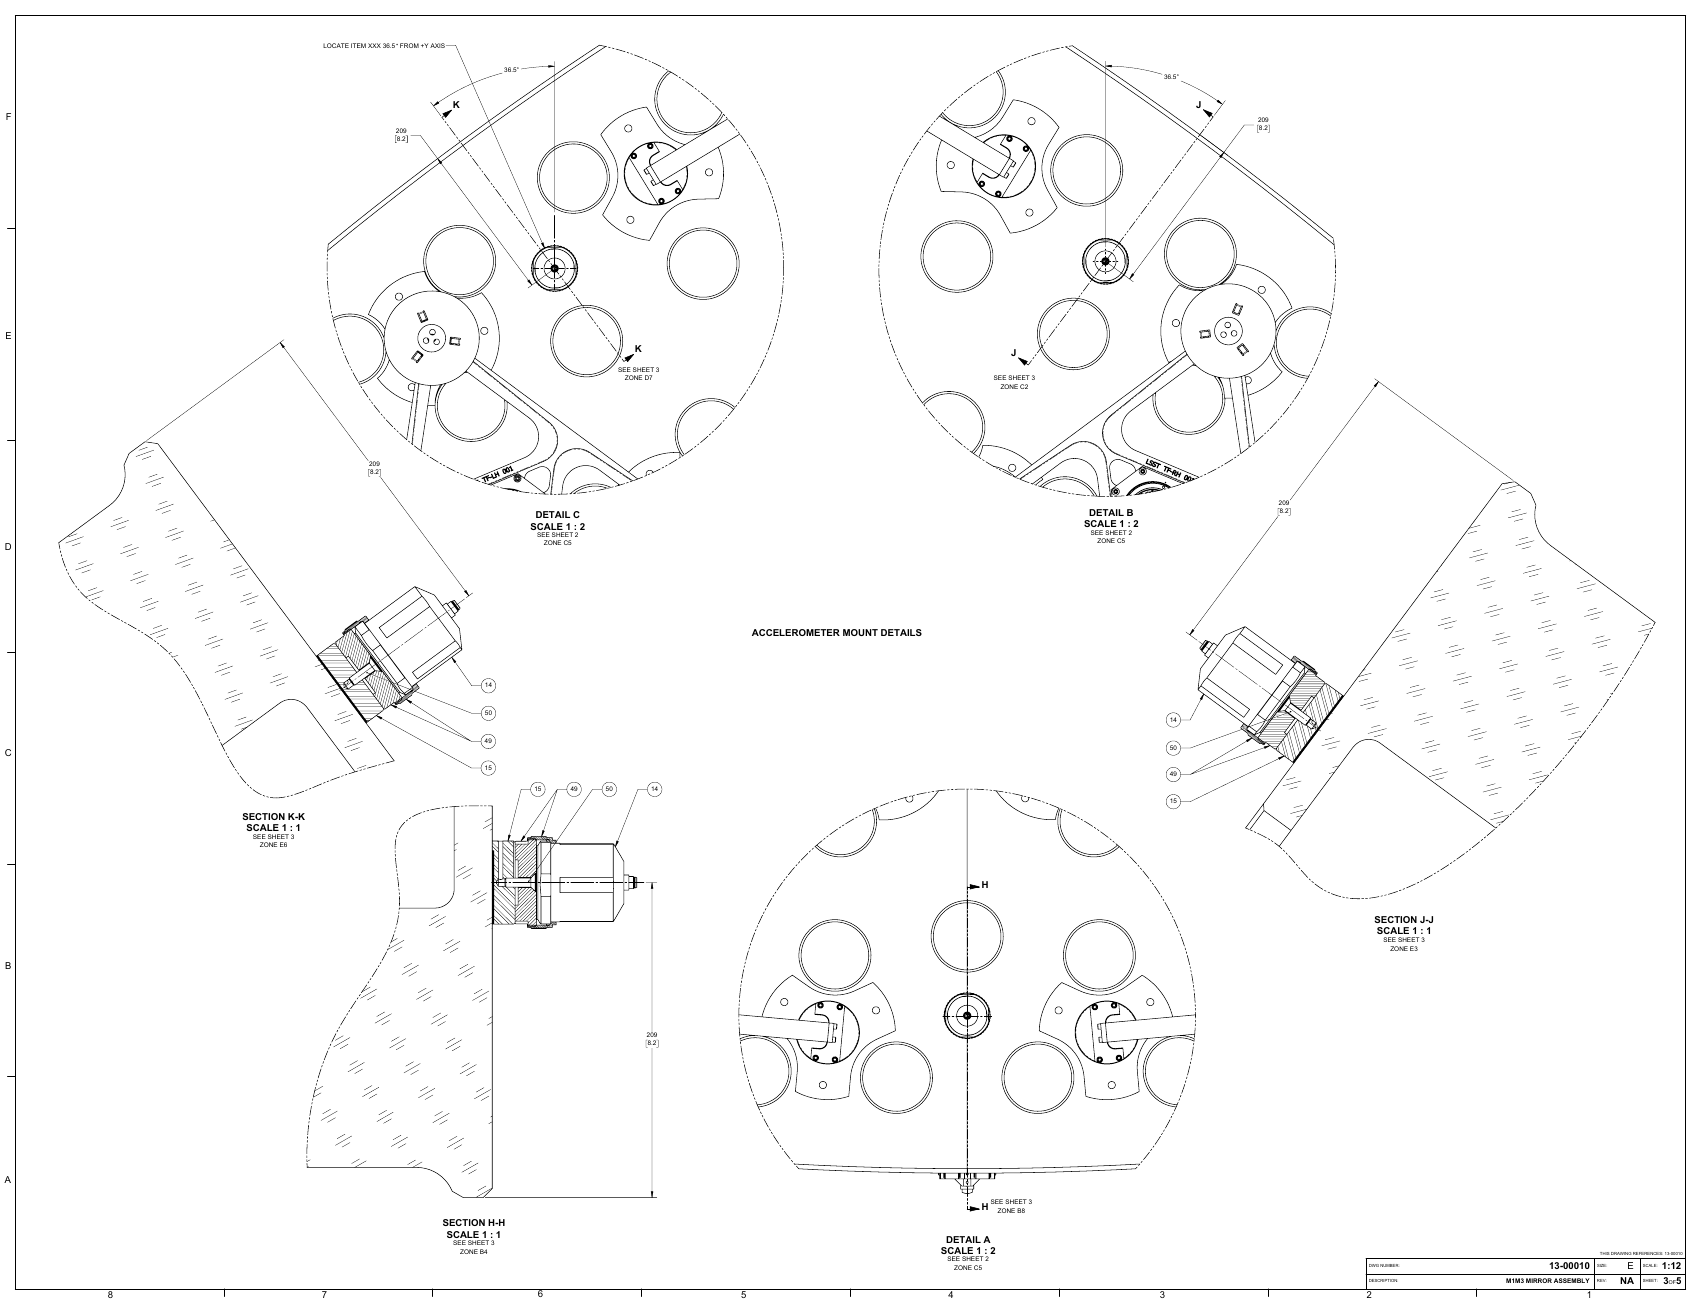
Fig. 2 Mount details of the 3 VMS accelerometers#
The VMS channels are readout with a sampling frequency of 200 Hz the corresponding datasets are written in hdf5 format on the vms-data.cp.lsst.org server at the summit. These large files (~1.3 GB) will eventually be copied on the LFA but in the mean time, some of them have been copied to /scratch/users/b/boutigny/vmsdata/ and some of them have been converted to a parquet format holding a more convenient pandas dataframe.
Note that VMS data also exists for M2 and for the Rotator.
Study of vibrations recorded by the VMS during slews#
For this study we have selected large amplitude azimuth et elevation slews occuring on December 21st, 2023.
The following plot shows the acceleration along the x axis recorded by VMS accelerometer #3 over a 24 hour-period on 2023/12/21. The other accelerometers / axes show a similar behavior. We see several occurences of vibration events. Some of them are reaching 0.075 10⁻³g.
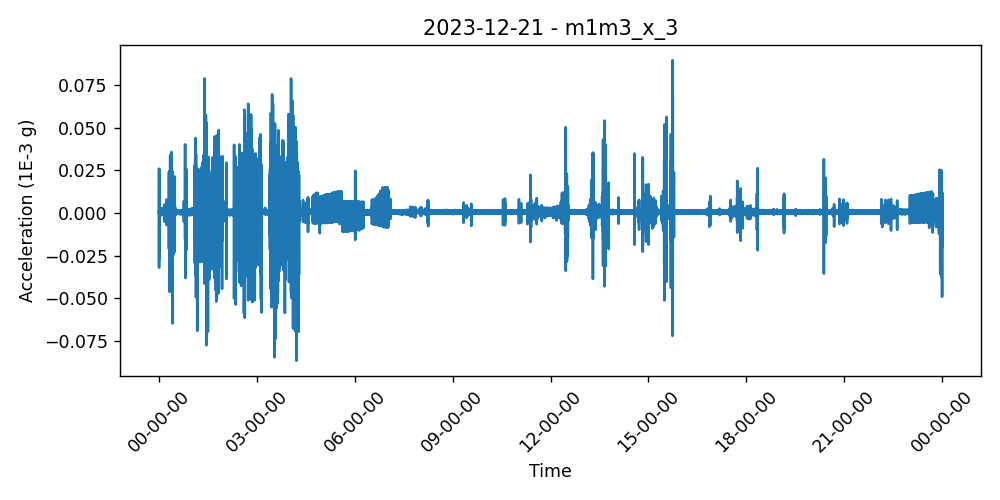
Fig. 3 Acceleration along the x axis recorded by VMS accelerometer #3 over a 24 hour-period on 2023/12/21#
During this day we identify 564 slews occuring between 00:00 and 23:59.
Azimuth slews#
In the following we are going to make a detailed analysis of one specific slew:
Seqnum: 91
Duration: 51.6 s
Amplitude: 200 deg (-100 - +100)
Speed: 4 deg/s
In the following figure we plot the VMS acceleration along x for accelerometer #3, TMA Orientation, TMA torque, TMA speed, M1M3 angular acceleration around x, y and z. The start and the end of the slew are indicated by the vertical dashed lines. We can identify the vibrations generated during the acceleration and deceleration phases corresponding to an increase of the TMA torque of +/- 500,000 N.m. During the TMA rotation at constant speed we see 4 vibration events lasting a few seconds. These vibrations are not associated to torque variations. We can also detect these events on the M1M3 angular acceleration around the z axis. The two other components of the angular acceleration, around x and y, do not show a significant signal associated to the vibration events.
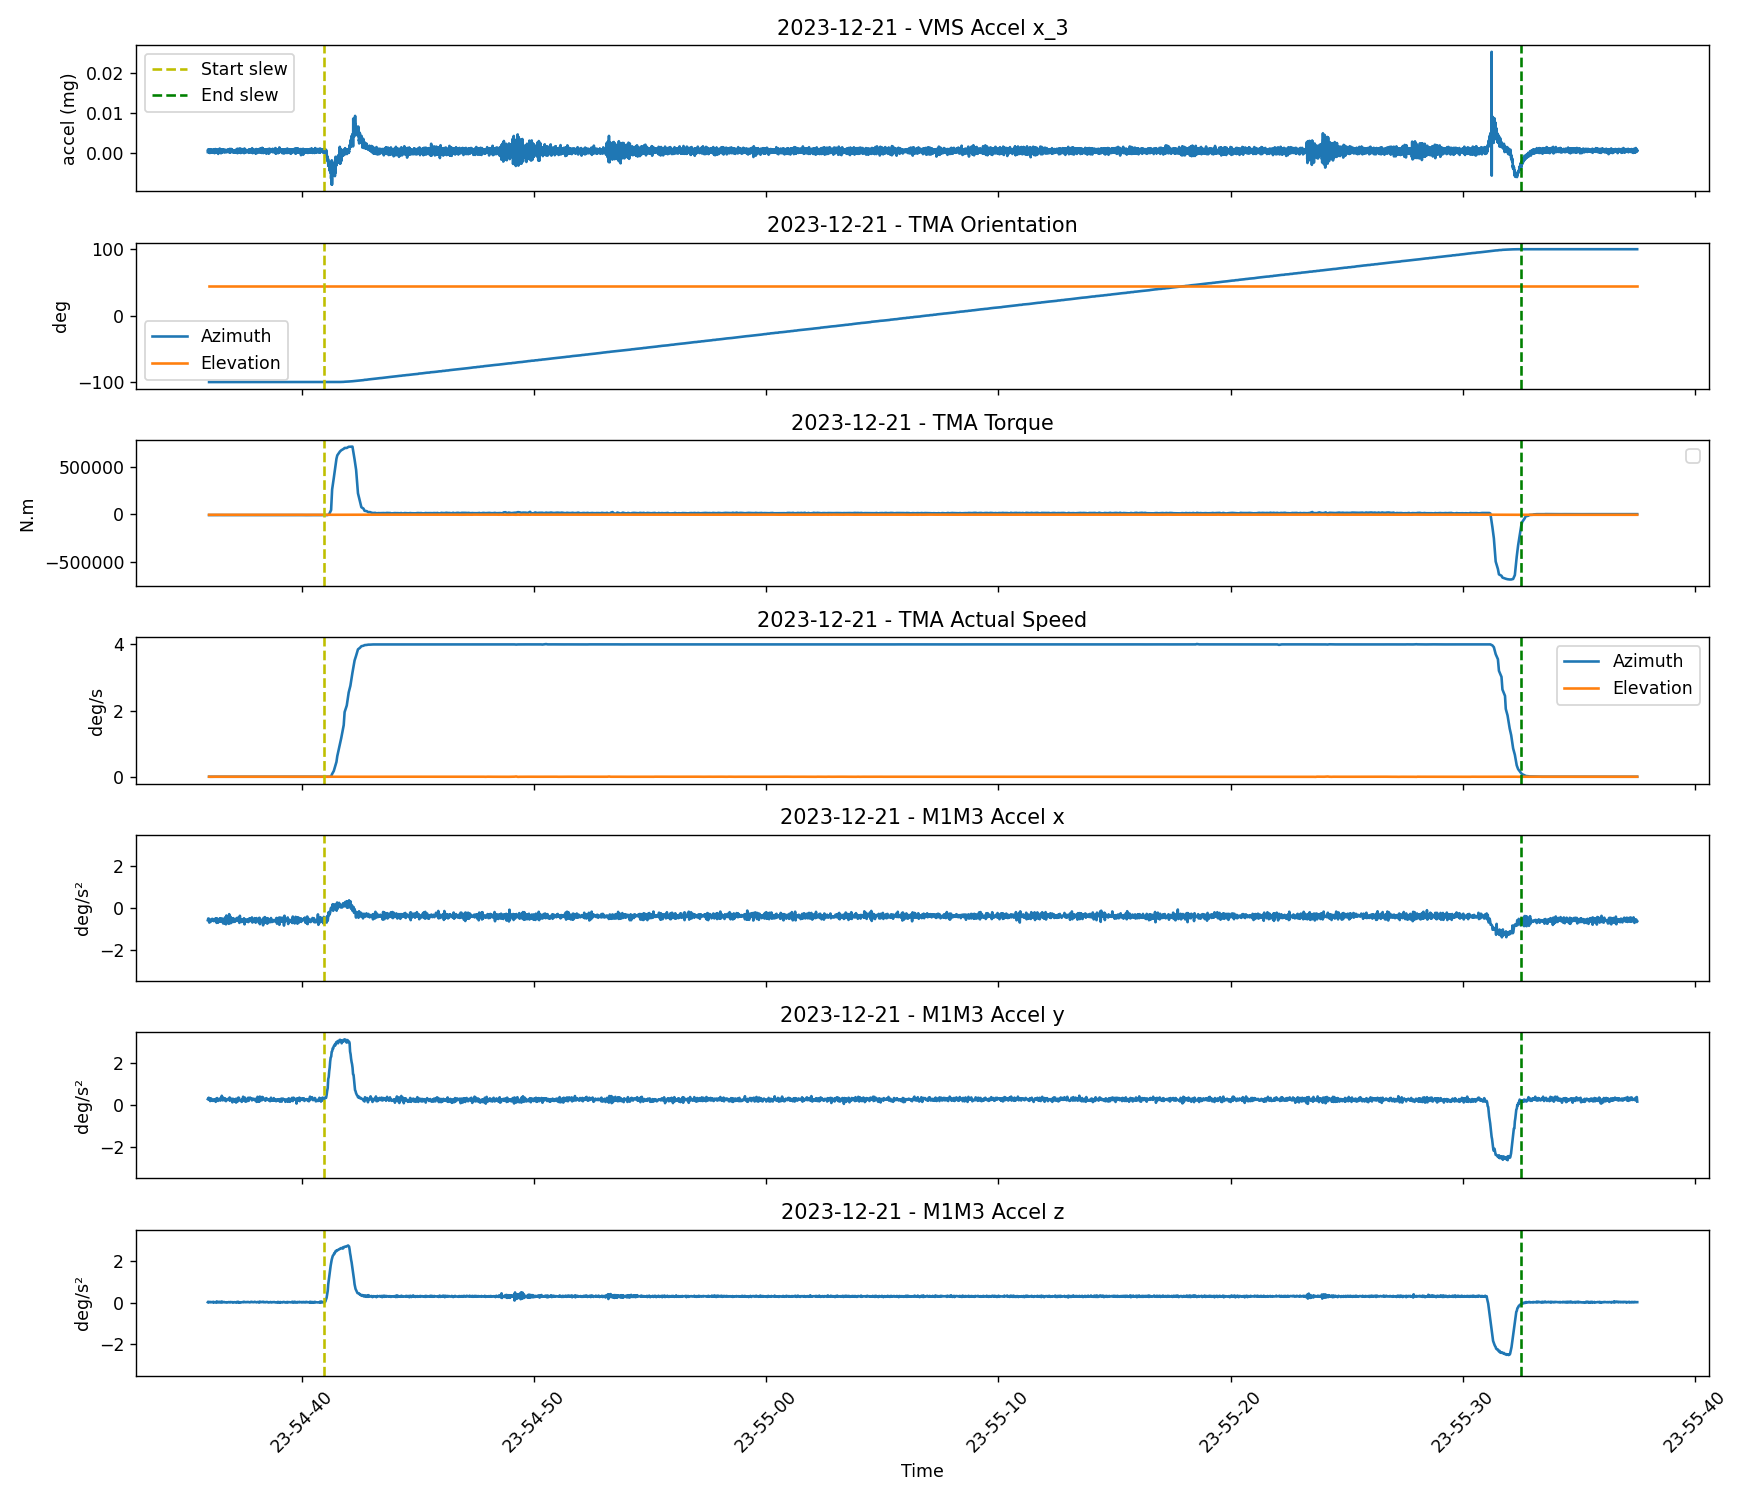
Fig. 4 VMS acceleration along x for accelerometer #3, TMA Orientation, TMA torque, TMA speed, M1M3 angular acceleration around x, y and z. The start and the end of the slew are indicated by the vertical dashed lines.#
The next plot is a zoom on the VMS data with TMA orientation superimposed. The start and the end of the slew are indicated by the vertical dashed lines.
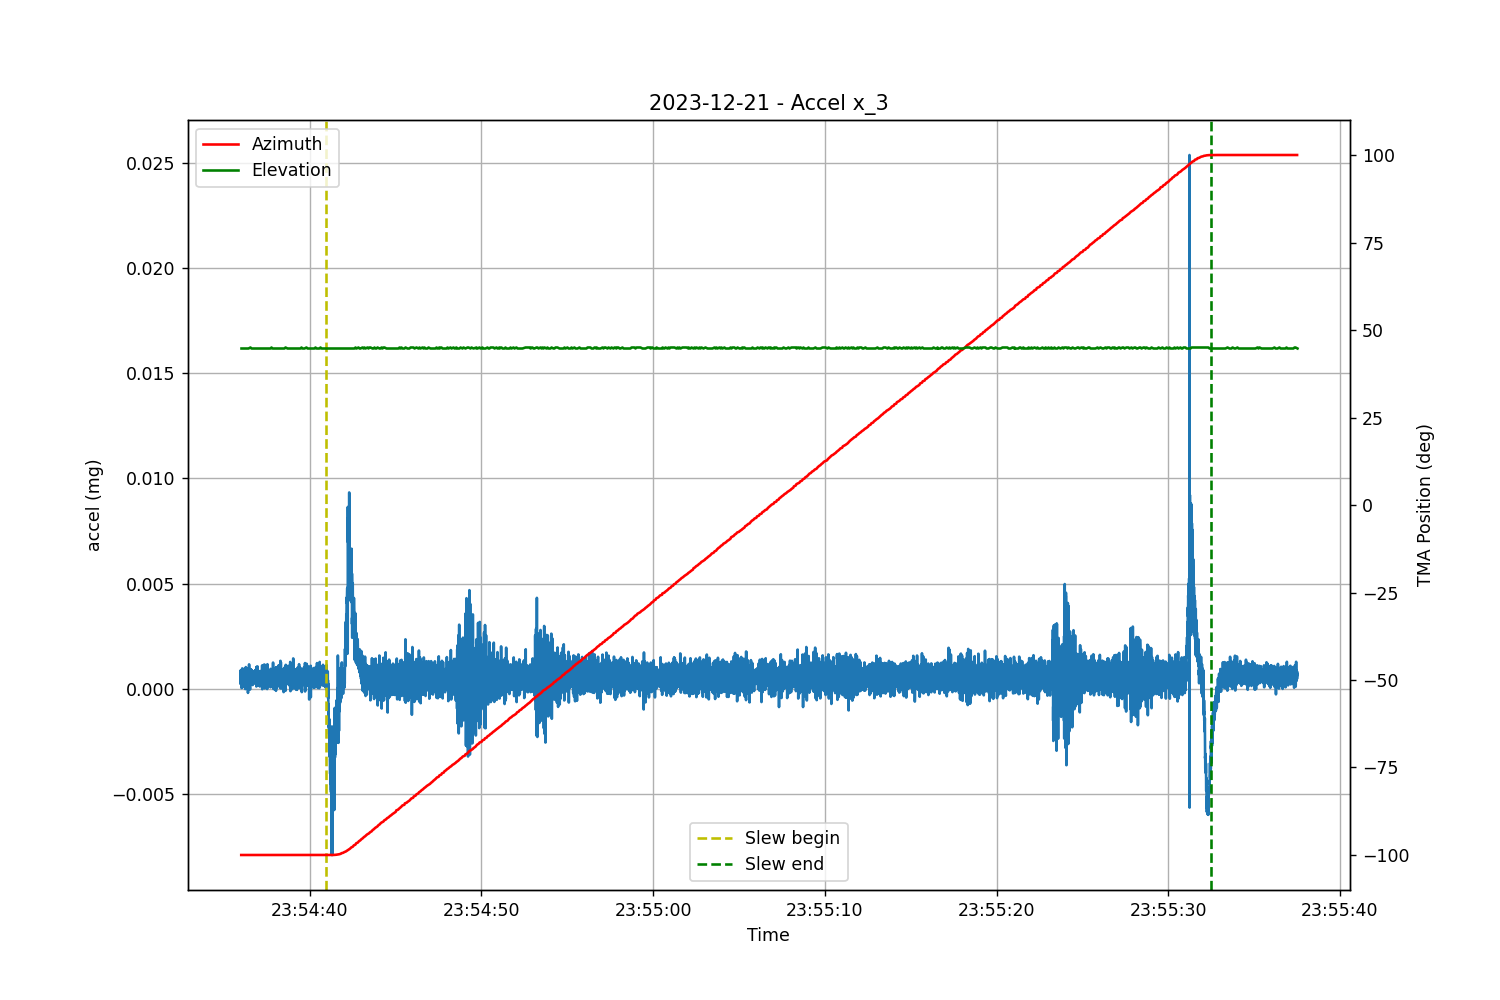
Fig. 5 VMS acceleration along x for accelerometer #3 with TMA orientation superimposed. The start and the end of the slew are indicated by the vertical dashed lines.#
The following plot shows the acceleration along x, y and z axis recorded by the VMS accelerometer #2 (other VMS accelerometers show the same behavior) and HP forces along the same axes.
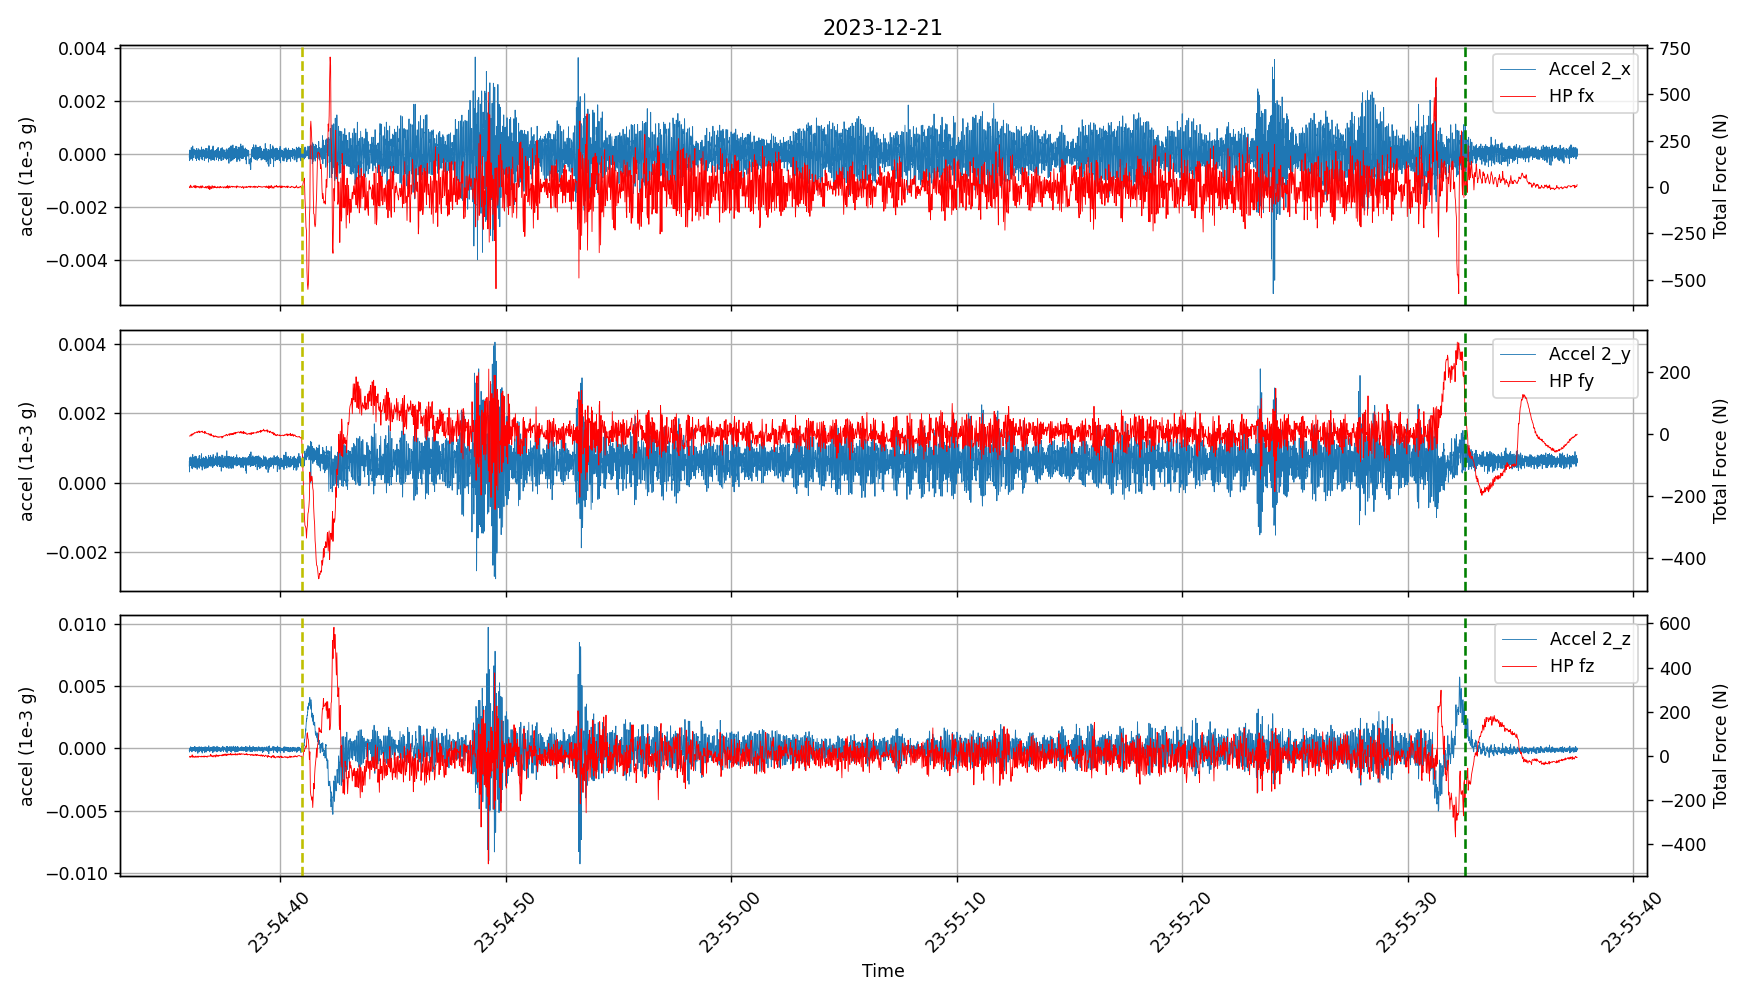
Fig. 6 VMS acceleration along x, y and z for accelerometer #2 (in blue) and HP forces along x, y and z (in red). The start and the end of the slew are indicated by the vertical dashed lines.#
We see that the first 2 glitches in the VMS plots are obvious around 23:54:50 in the HP forces plot, the 2 others around 23:55:25 are much less visible. Depending on the slew, the glitches are more or less evident in the HP forces plot.
The following plots are spectrograms of the signal recorded by the 3 VMS accelerometers along the x, y and z axes.
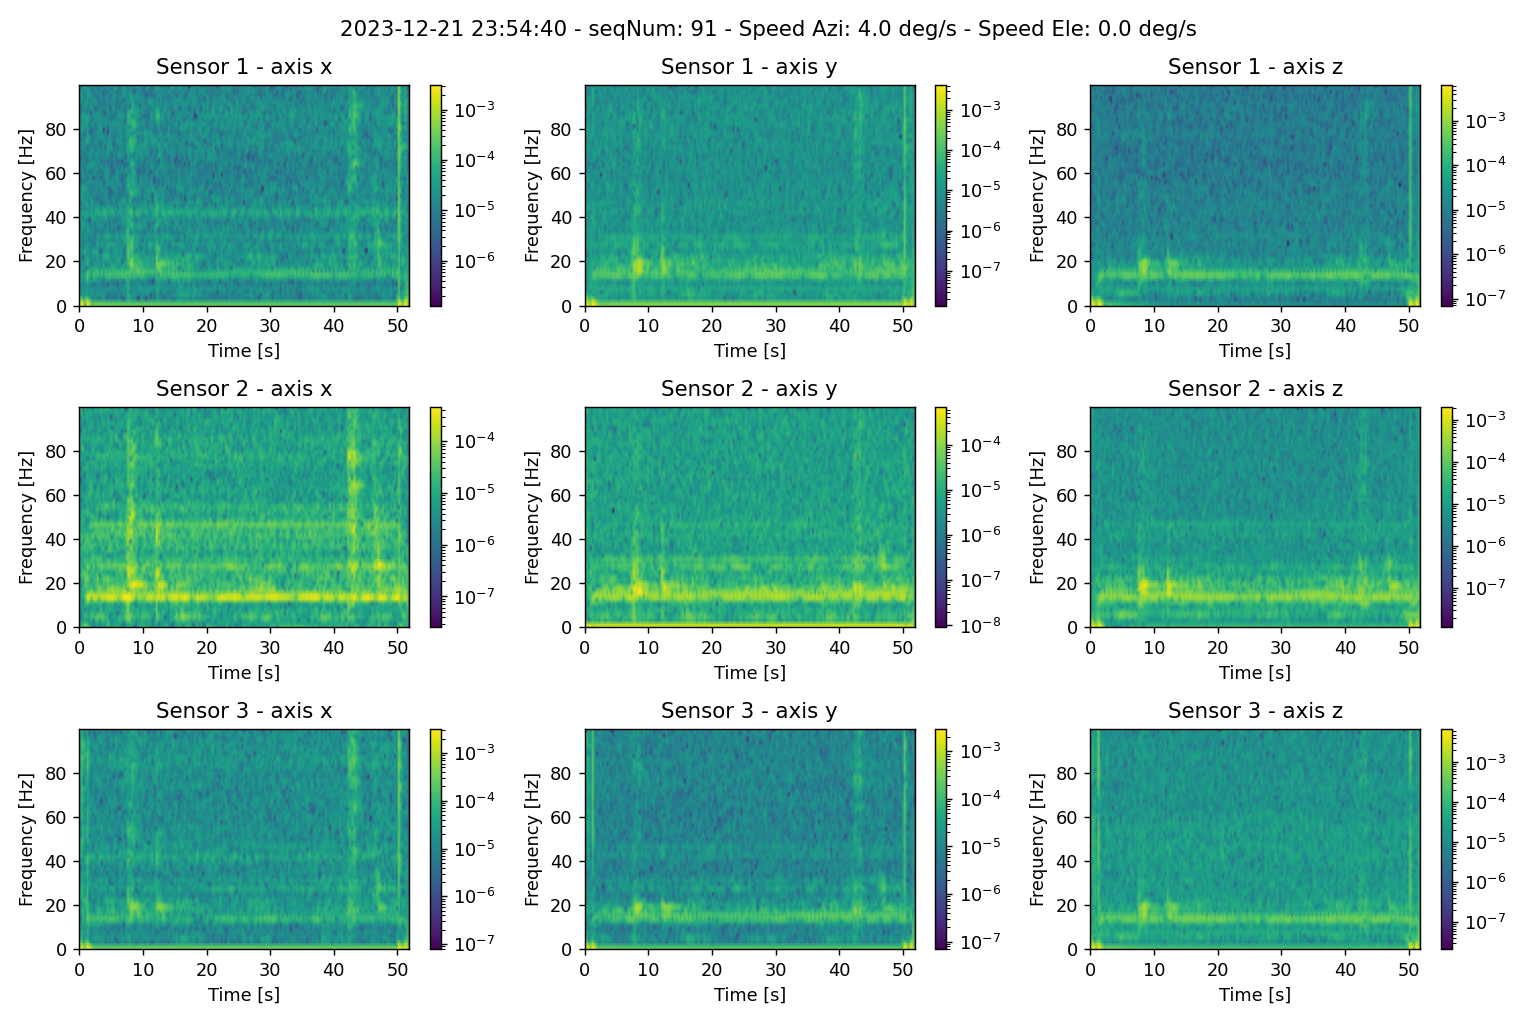
Fig. 7 Spectrograms of the signal recorded by the 3 VMS accelerometers along x, y and z.#
The glitches appear as vertical lines extending from ~20 Hz up to ~80-100 Hz. The spectrograms also show horizontal lines corresponding to vibrations occuring all along the slew. The most obvious horizontal lines are around ~15 Hz and ~45 Hz. A more careful Fourier analysis will be performed later in this techncal note. The strong vibrations occuring while the TMA is accelerating and decelerating are barely visible in the spectrograms at very low frequencies (yellow spots at the bottom left and bottom right).
In order to locate precisely the position of the TMA where the glitches appear, we first apply a high-pass Butterworth filter on the VMS data (cutting frequency = 20 Hz) then we take the square of the signal, normalize it to the unity and rebin it in order to filter out the fluctuations. We also cut out the beginning and the end of the dataframe in order to avoid the acceleration and deceleration phases. We can then automatically detect the peaks and find the time at which they appear. From thiese times it is easy to retrieve the corresponding TMA position in azimuth. The result is shown on the following figure.
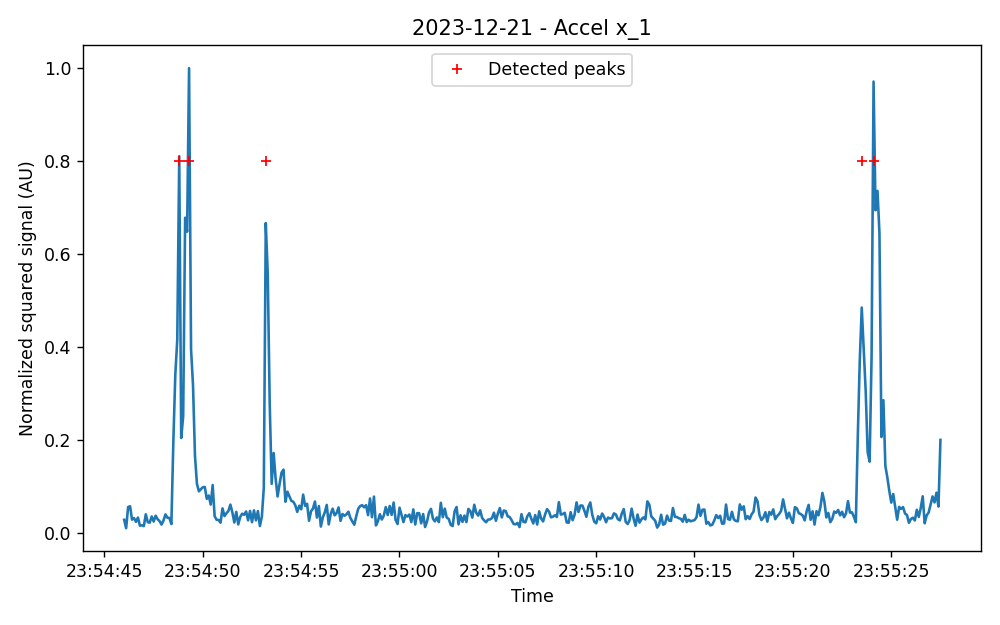
Fig. 8 VMS signal from accelerometer 1 along the x axis filtered and rebinned in order to be able to locate the glitches (corresponding to the peaks in the plot).#
On this particular slew we find 5 glitches corrresponding to the following azimuth angles: [-72.5 -70.3 -54.7 66.3 68.7] degrees. Note that these positions are not very accurate as the glitches have a certain duration and the definition of their time of occurence is ambiguous (at least with the method used).
We have analyzed several large amplitude slews with the TMA rotating in both directions and got the following locations for the glitches:
Seqnum 91: [-72.5 -70.3 -54.7 66.3 68.7] degrees
Seqnum 92: [ 82.8 80.2 65.4 -55. -57.2 -74.6 -77.6] degrees
Seqnum 94: [ 82.8 80.8 65.8 -54.8 -57. -74.4 -76.4] degrees
SeqNum 137: [-70.7 -60.9 -53.9 68.3 86.1] degrees
Taking into account the uncertainty on the glitches localization we see that they tend to appear close to the same TMA azimuth angles: ~-75 deg / -55 deg / +65 deg / +80 deg. The cause of these vibrations is unknown.
The next figure summarize the results of the PSD analysis on the 3 axes of the 3 VMS accelerometers.
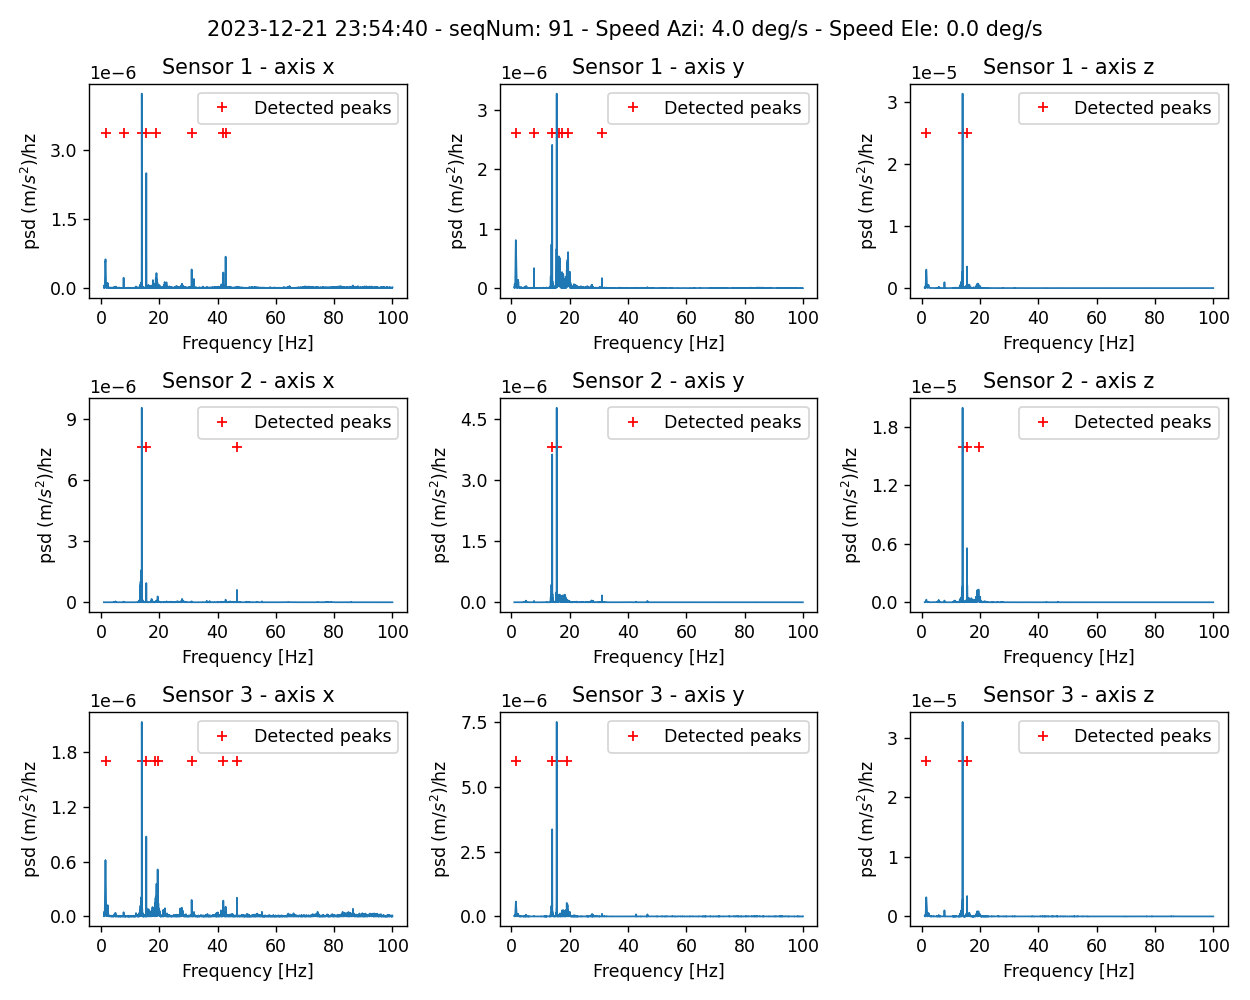
Fig. 9 PSD (acceleration) for the 3 axes of the 3 VMS accelerometers. The detected frequency peaks are ndicated by a red cross.#
The detected peak frequencies in Hz for the different accelerometers / axes are the following:
Accel 1 - x - Frq: [1.57, 7.78, 14.01, 15.56, 19.05, 31.11, 41.98, 42.77]
Accel 1 - y - Frq: [1.53, 7.78, 14.01, 15.56, 16.33, 17.38, 19.46, 31.11]
Accel 1 - z - Frq: [1.53, 14.01, 15.56]
Accel 2 - x - Frq: [14.01, 15.56, 46.67]
Accel 2 - y - Frq: [14.01, 15.56]
Accel 2 - z - Frq: [14.01, 15.52, 19.48]
Accel 3 - x - Frq: [1.57, 14.01, 15.56, 18.58, 19.46, 31.11, 41.98, 46.67]
Accel 3 - y - Frq: [1.55, 14.01, 15.56, 19.01]
Accel 3 - z - Frq: [1.55, 14.01, 15.56]
The very low frequency around 1.6 Hz is very likely associated to the acceleration and deceleration phases.
Elevation slews#
Finding data period with large amplitude elevation only slews is more difficult than for azimuth slew. We selected the following one:
dayObs: 20231221
seqNum: 79
duration: 32.5s
amplitude: 62 deg (20 - 82 deg)
speed: 2 deg/s
The following plot shows the VMS acceleration along y for accelerometer #2, the TMA Orientation, the TMA torque, the TMA speed and M1M3 angular acceleration around x, y and z
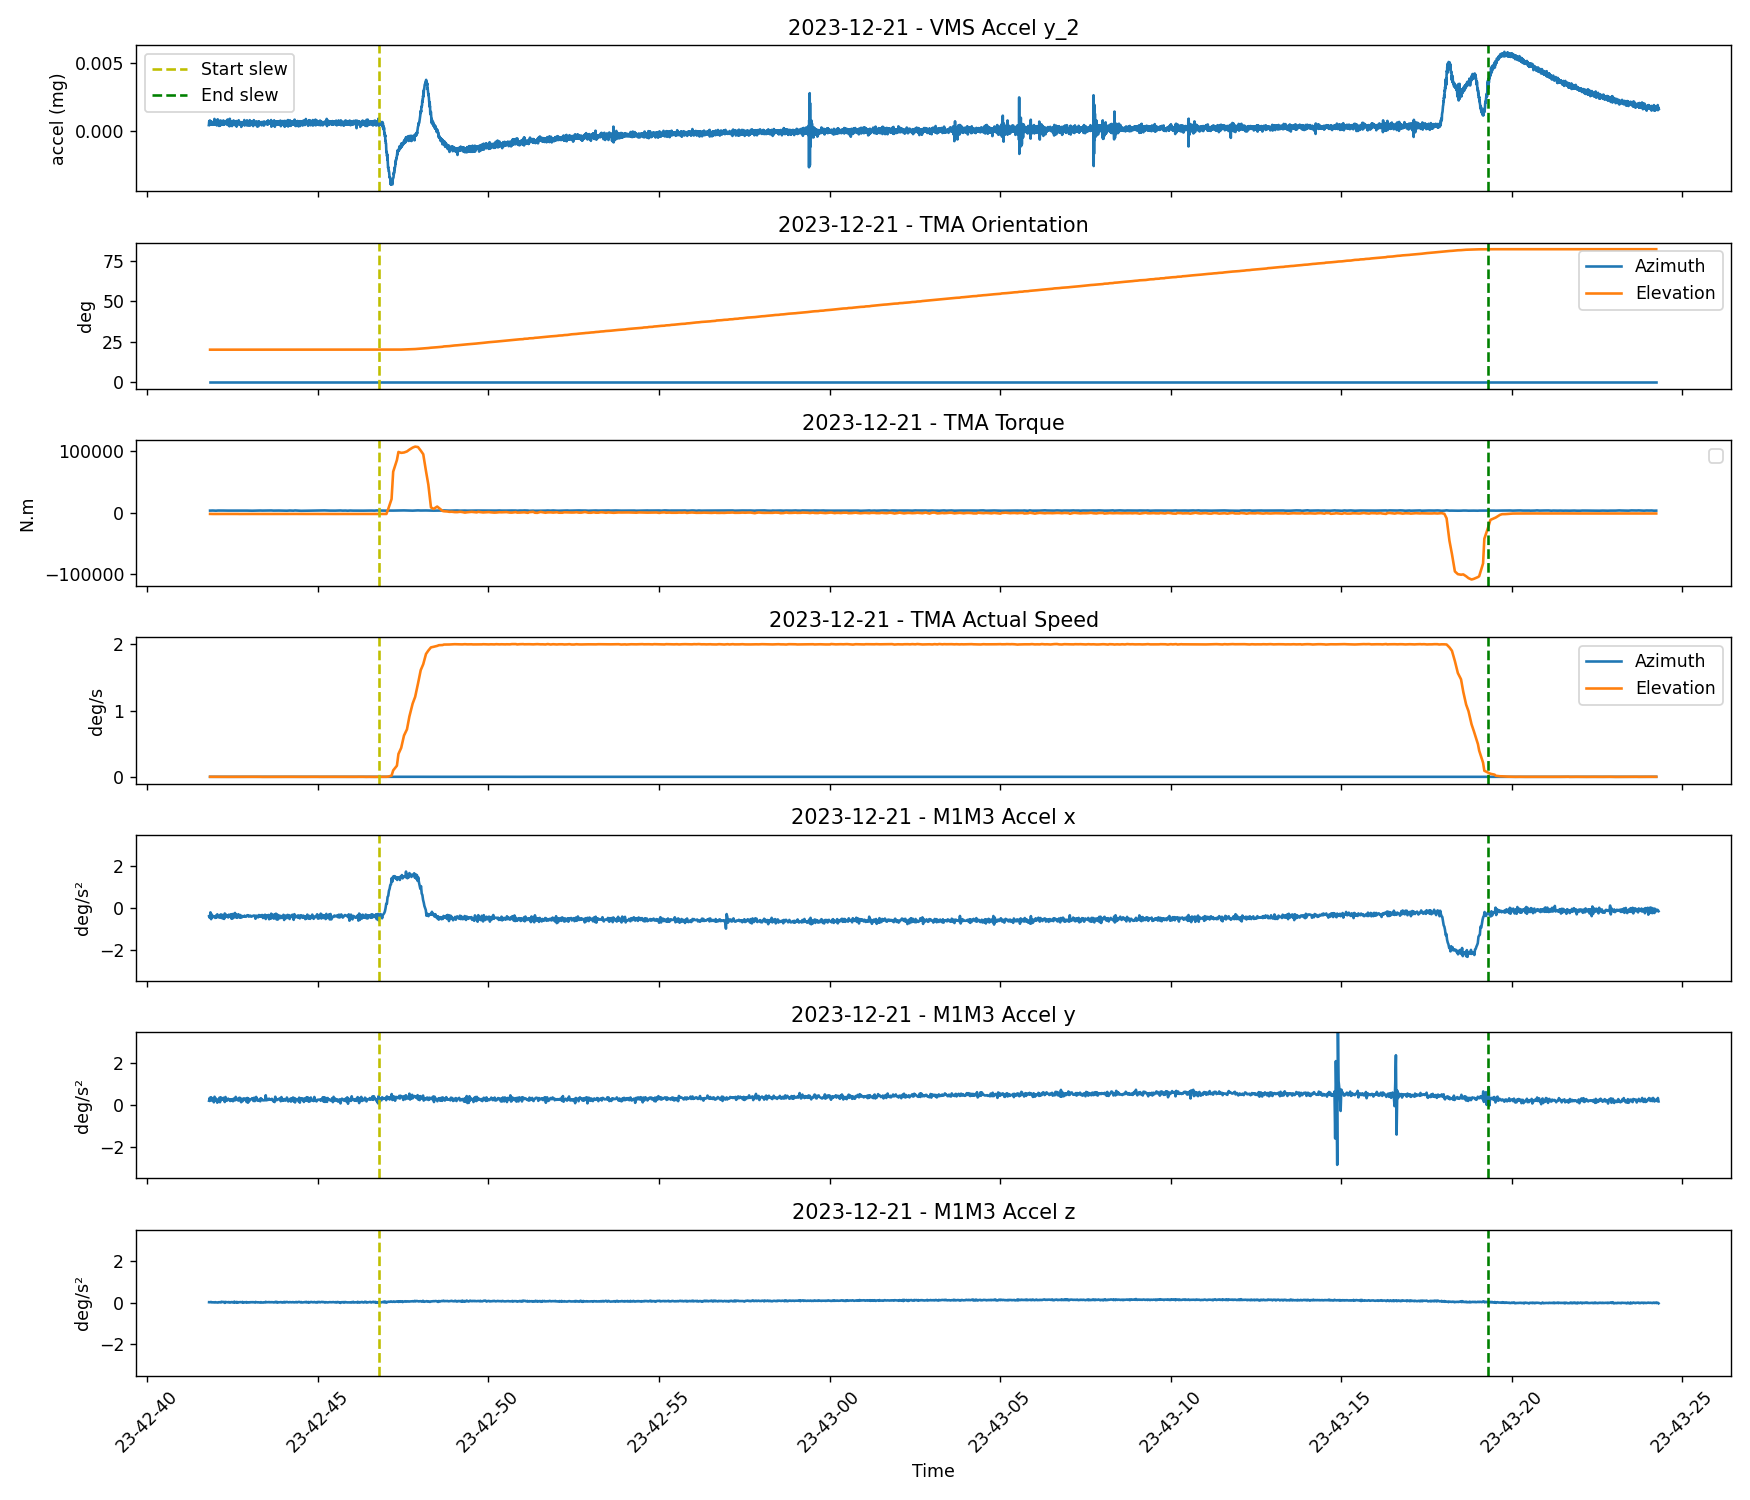
Fig. 10 VMS acceleration along y for accelerometer #2, TMA Orientation, TMA torque, TMA speed, M1M3 angular acceleration around x, y and z. The start and the end of the slew are indicated by the vertical dashed lines.#
During the slew and between the acceleration and deceleration phase, we see a few vibration occurences detected by the VMS
The following plot shows the acceleration along x, y and z axis recorded by accelerometer #2 and HP forces along the same axes.
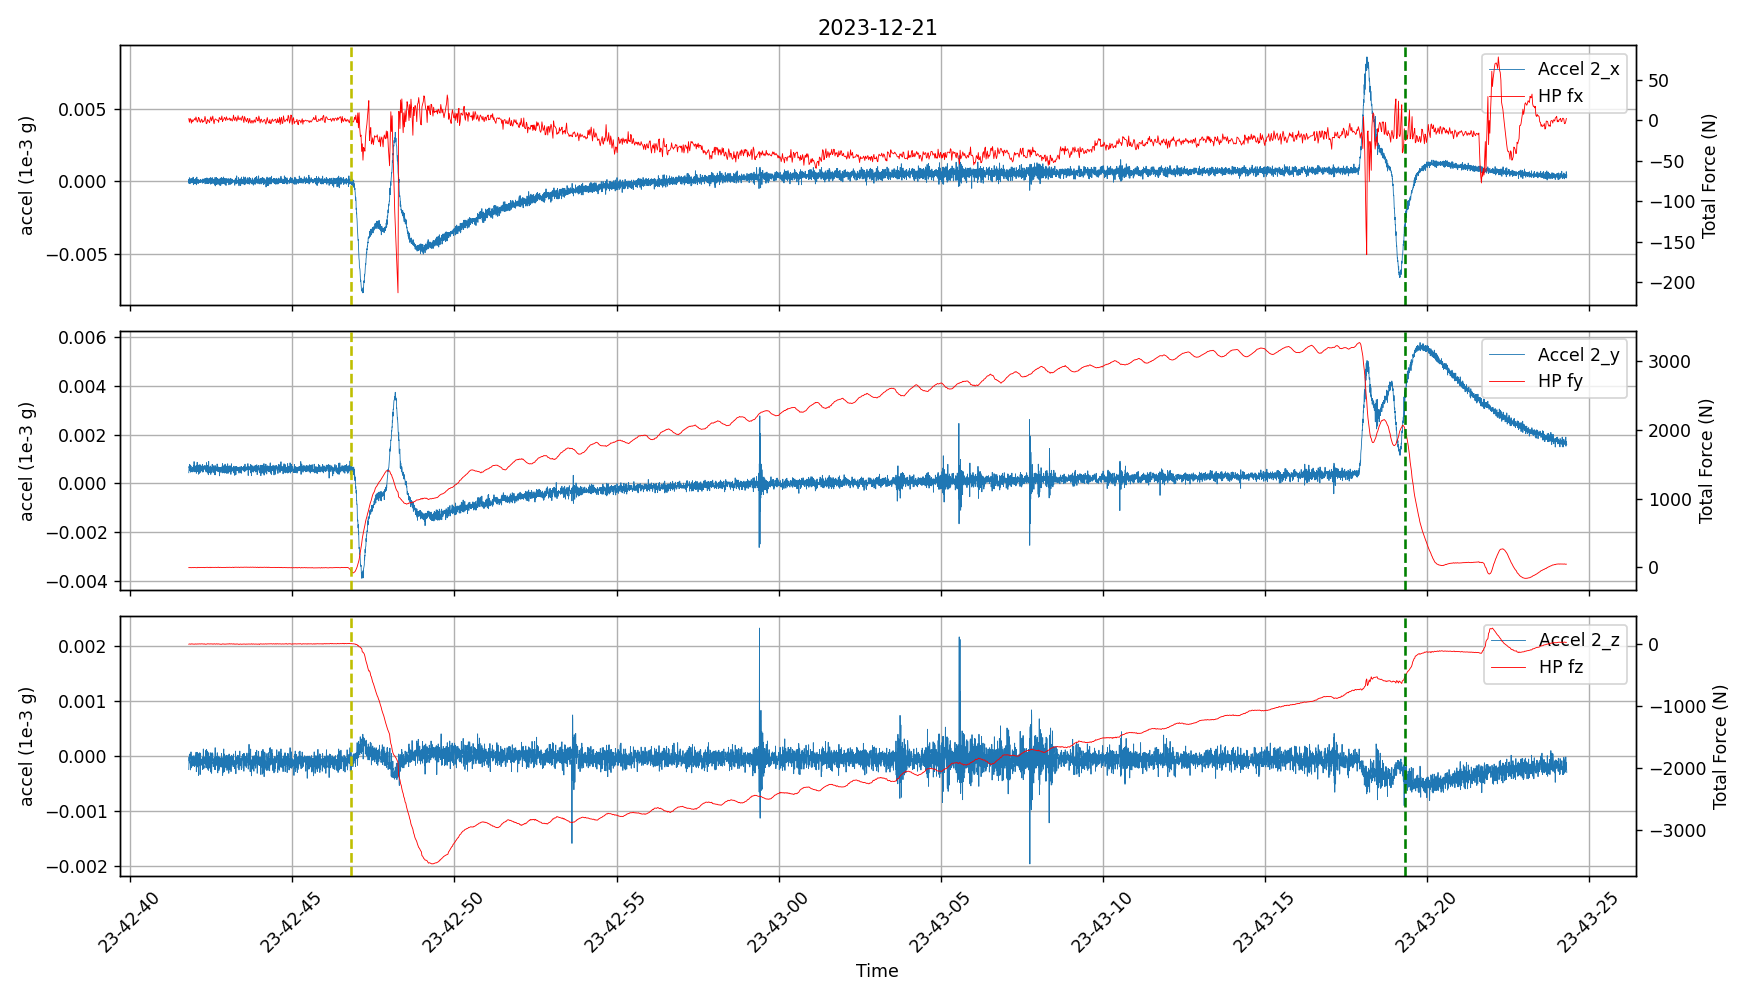
Fig. 11 VMS acceleration along x, y and z for accelerometer #2 (in blue) and HP forces along x, y and z (in red). The start and the end of the slew are indicated by the vertical dashed lines.#
From this plot, we see that the larger HP forces are applied along the y and the z axes and we notice a correlation between the vibrations seen by the VMS along these 2 axes (spikes occure at the same time). Given the scale of the HP forces in y and z directions (much more important than for an azimuth slew) it is impossible to detect any correlation between HP forces and VMS vibrations.
An analysis of the VMS vibration similar to the one described for the azimuth slew shows that the most prominent glitches appear when the TMA elevation is around: [43.4 55.7 60.0 61.3 65.7] degrees. The same analysis on another elevation-only slew (2023-12023 0- seqNum: 205) shows glitches at: [52.7 53.9 55.3 58.1 60.1] degrees. Even if from these 2 slews, it seems that some glitches appear around the same elevation values, it is impossible to draw any definitive conclusion with such a low statistics.
Similarly to the azimuth analysis, the following figure shows the spectrogram of the VMS data for the 3 accelerometers and the 3 axes.
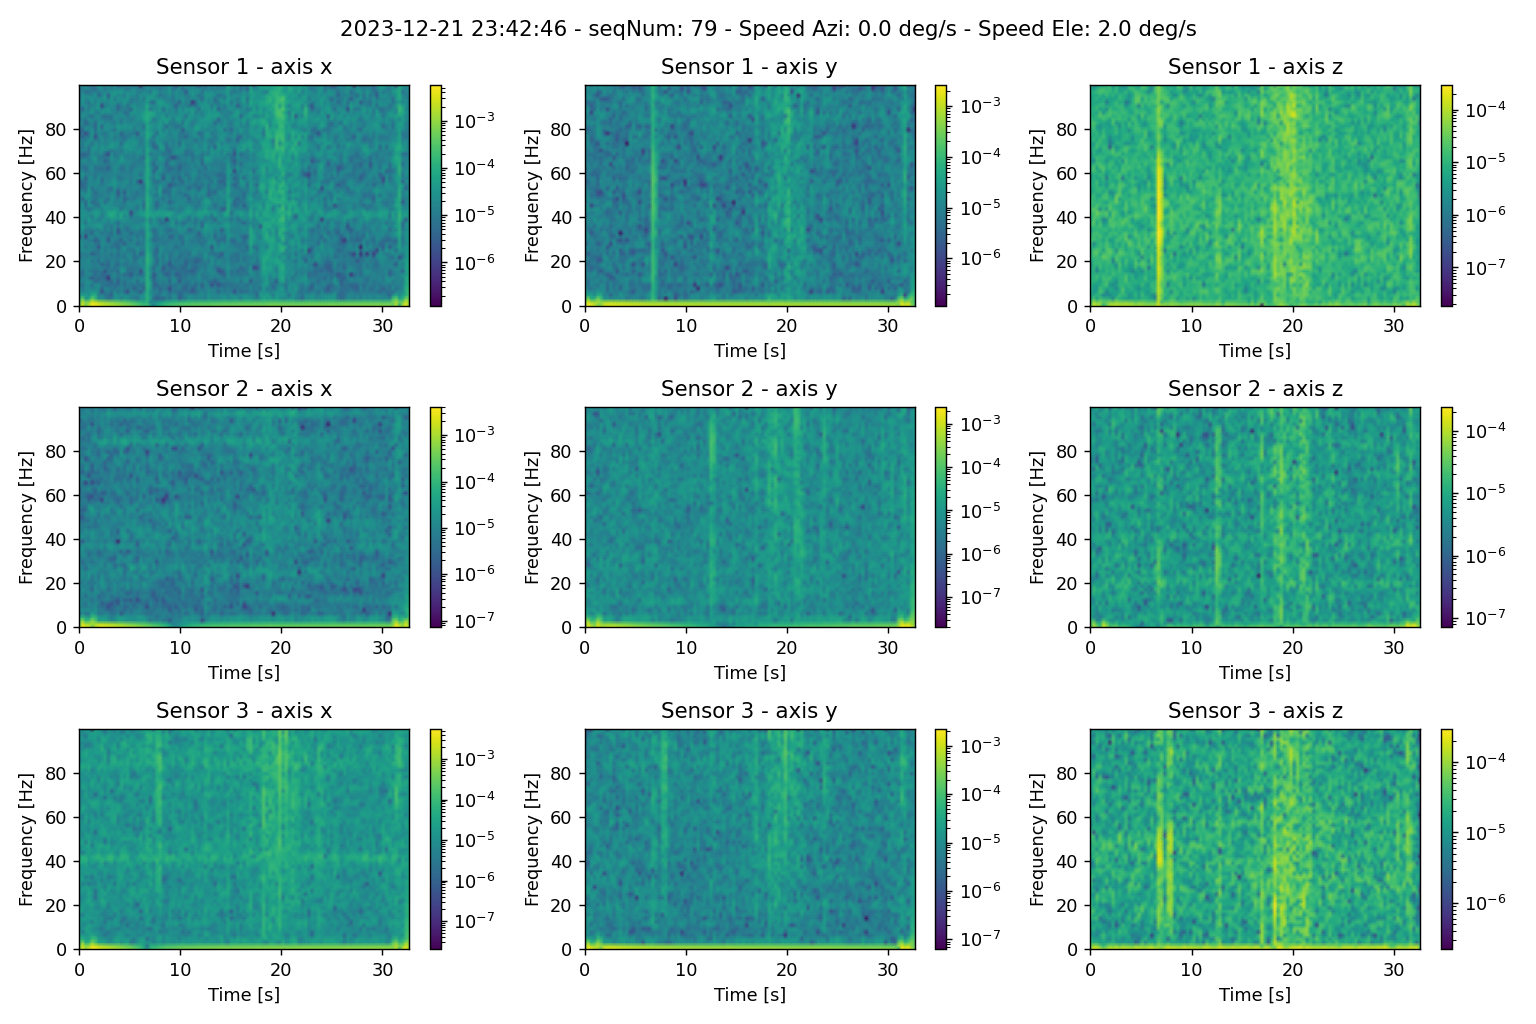
Fig. 12 Spectrograms of the signal recorded by the 3 VMS accelerometers along x, y and z.#
The glitches are seen as vertical bands covering the whole frequency range and are visible in most of the spectrograms. A few horizontal bands are visible, with one obvious around 40 Hz.
Analysis of VMS data when the TMA is tracking#
In order to complete this study, we have selected an event where the TMA is tracking after slewing to a target position.
dayObs: 20231221
seqNum: 535
duration: 42s
In the following figure, we plot the VMS acceleration the z axis for accelerometer #2, the TMA orientation, the TMA torque and the TMA speed
Fig. 13 VMS acceleration the z axis for accelerometer #2, TMA orientation, TMA torque and TMA speed.#
The VMS doesn’t show strong vibrations (the scale of the plot is one order of magnitude smaller than the one for the azimuth slew).
In the following figure, we plot the PSD (acceleration) for all the axes of the 3 accelerometers.
Fig. 14 PSD (acceleration) for all the axes of the 3 accelerometers.#
The only noticeable thing are some peaks in frequency visible for the x axis of all 3 accelerometers. The peak at about 42 Hz, often seen in VMS data, is visible here.
The strong vibration event of June 28th, 2023#
This peculiar strong vibration event is reported in the 23.06.27 M1M3 Test Log: https://confluence.lsstcorp.org/display/LSSTCOM/23.06.27+-+M1M3+Test+Log. The vibration occured around 1:08 am (on the 28th) during an elevation slew and continued even when the mirror was lowered to its rest position.
Analysis#
The notebook associated to this analysis is attached to the Technical Note directory : SITCOMTN_131_M1M3_VMS_TMA_Coupling_investigation_strong_shaking-28-0602023.ipynb
The following plot shows the acceleration along the x-axis recorded by the accelerometer 3 (other accelerometers and other axes show the same behavior) during 24 hours on 2023-06-28
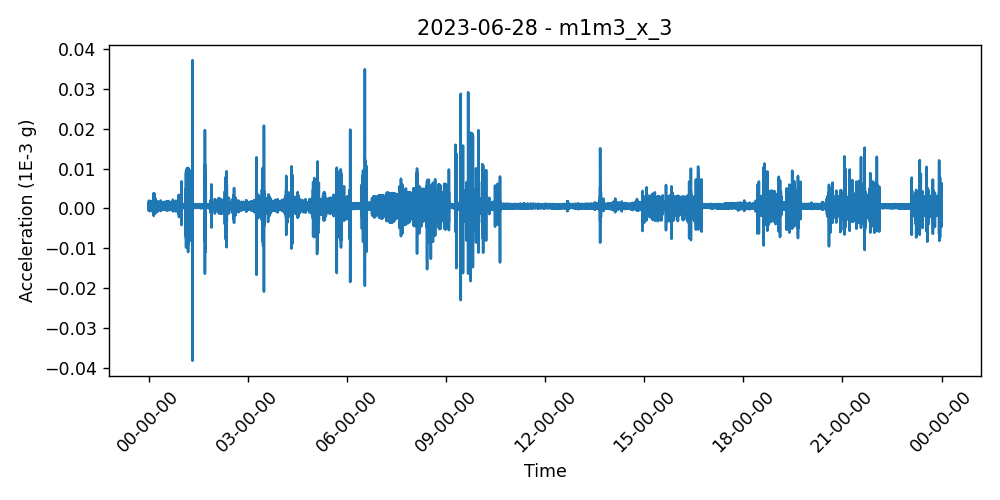
Fig. 15 Acceleration in mili-g along the x-axis recorded by accelerometer 3 on 2023-06-28#
We see several occurences of periods with vibrations. The amplitude of the vibrations are not especially strong and look similar or even weaker than vibration events observed at other periods.
The next plot is showing the response of various sensors during a ~15 minutes time window covering the strong vibration event. From top to bottom, we have: The x-axis of VMS accelerator 3 (the other accelerometers and axes show the same bahavior), the TMA orientation in azimuth and elevation, the TMA Torque, the TMA actual speed, the TMA demand speed and the x, y, z angular accelerations recorded by the M1M3 accelerometers. We have also indicated with vertical lines the occurence of significant events like the slew start and stop, the time when the command to lower M1M3 has been issued, the time when the mirror was in the lower position and finally the time when the TMA was switched off (CSC Disable).
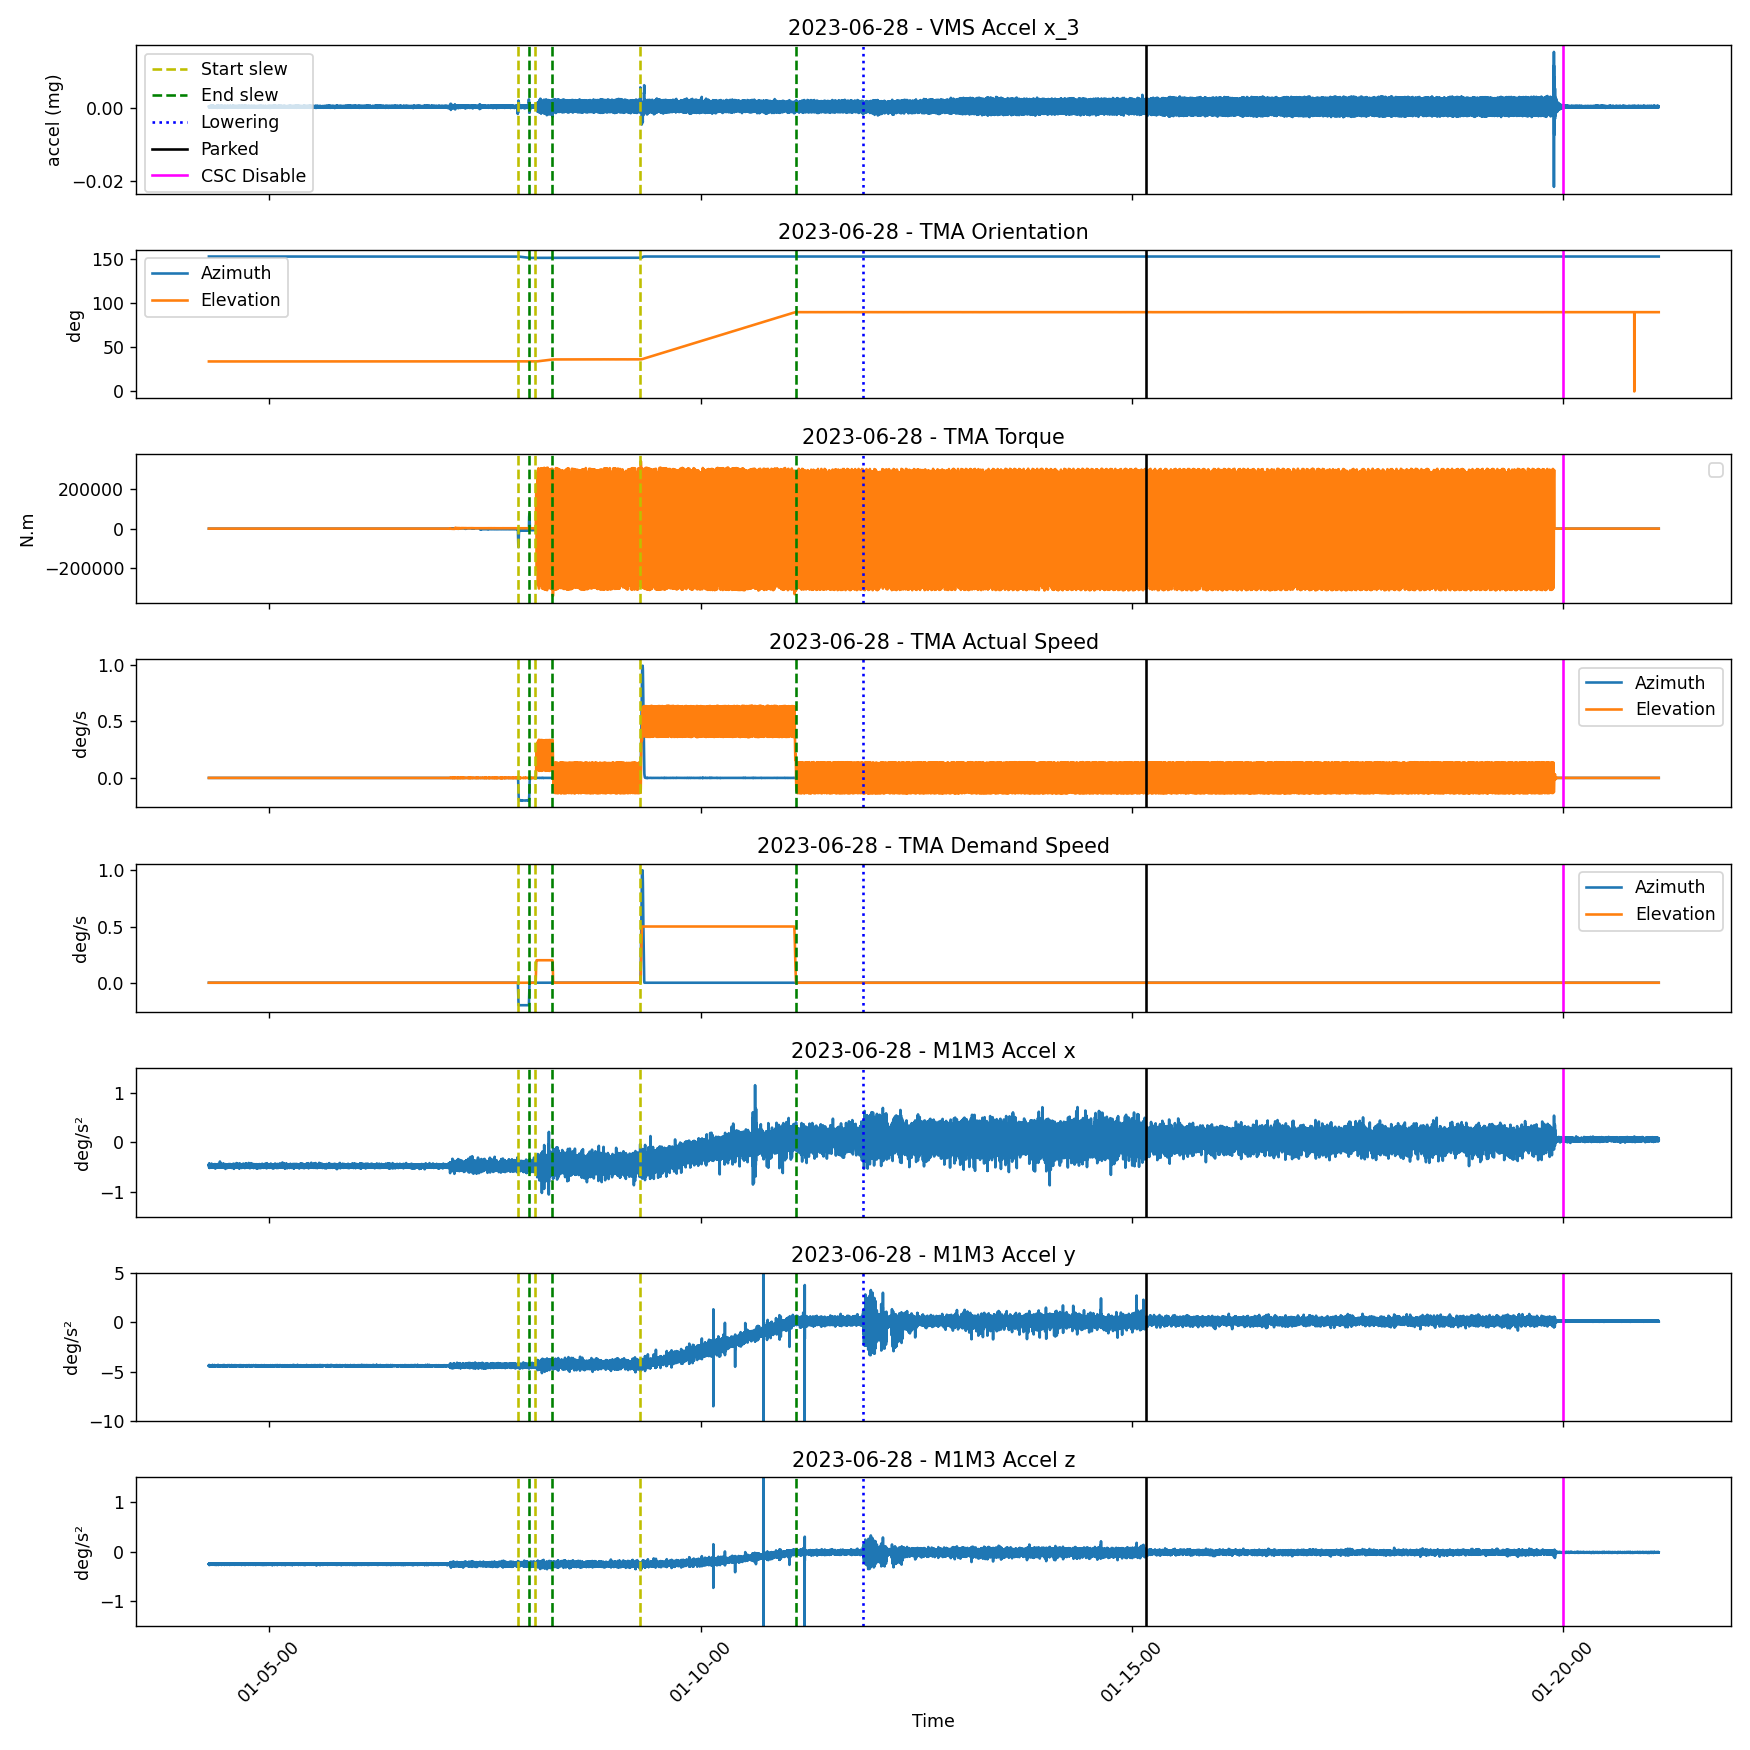
Fig. 16 Response of various sensors during a ~15 minutes time window covering the strong vibration event on 2023-06-28. The vertical lines shows the occurences of significant events (see description in the plot legend).#
The chronology of events is the following:
Short slew in azimuth - No significant vibration.
Short slew in elevation - Sensors show strong low frequency vibrations and the Torque is also oscillating with a large amplitude (-200,000 - + 200.000 N). The TMA speed is also oscillating .
At 01:09:17, longer slew in elevation (53.5 deg) at a speed of 0.6 deg/s - The strong low frequency vibrations seen by the VMS and by the Torque sensor continue.
The strong vibrations continue even after the TMA reached the target position in elevation and the slew stops (at 01:11:06).
At 1:11:52 the command to lower M1M3 is issued.
At 1:15:09 M1M3 is parked but the strong vibrations continue.
Finally, at 1:19:59 the TMA is disabled and the strong vibrations stopped. Before TMA stops, the VMS accelerometer 3 / x-axis is showing a short strong spike.
The next plots shows the Hard Points total forces in x, y and z superimposed to the accelerations recorded by the VMS along the 3 axes for the accelerometer number 2. As for the previous plots the occurences of significant events are indicated by vertical lines.
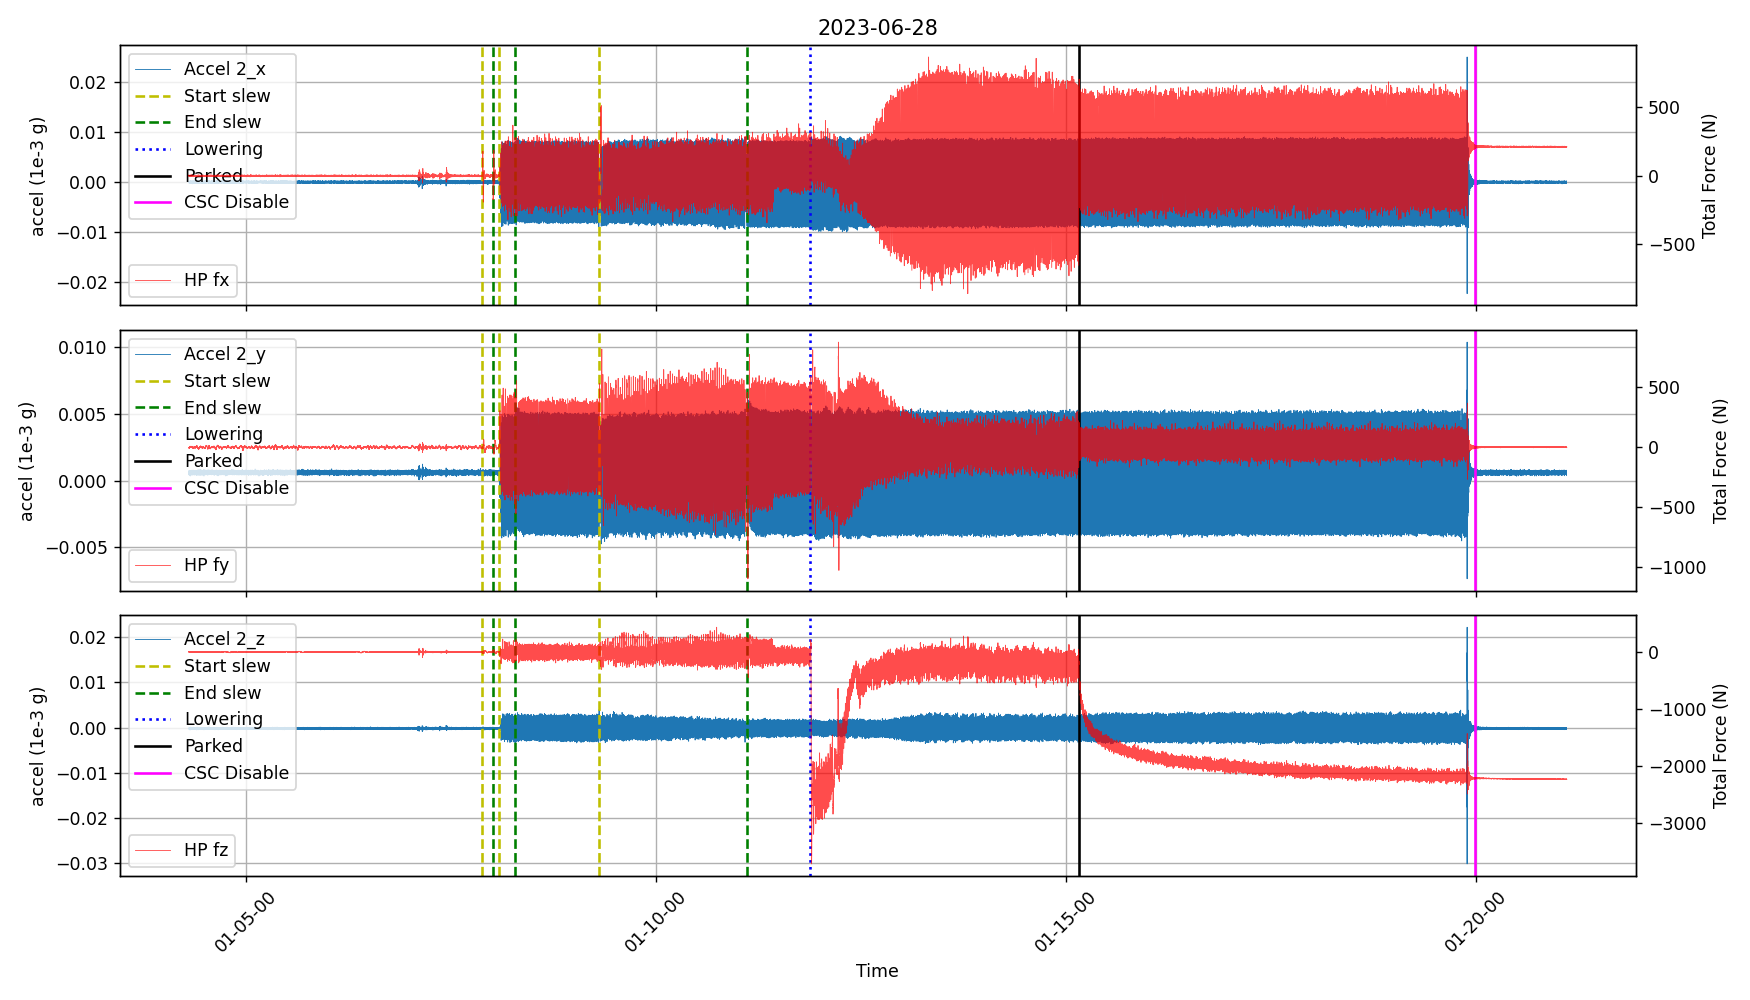
Fig. 17 Hard Points total forces nd acceleration recrded by the VMS during a ~15 minutes time window covering the strong vibration event on 2023-06-28#
We see that even if the vibration experienced by the TMA is strong, the forces seen by the Hard Points stay within ~ -500 to 500 Newtons, far from the HP breakout threshold.
The next figure shows the result of a Fourier analysis of the signal recorded by the VMS accelerators. The red crosses indicate the position of the identified peaks. The peak corresponding to the frequency of the strong vibrations is seen on the 3 axes of the 3 accelerometers. The frequency is 1.26 Hz.
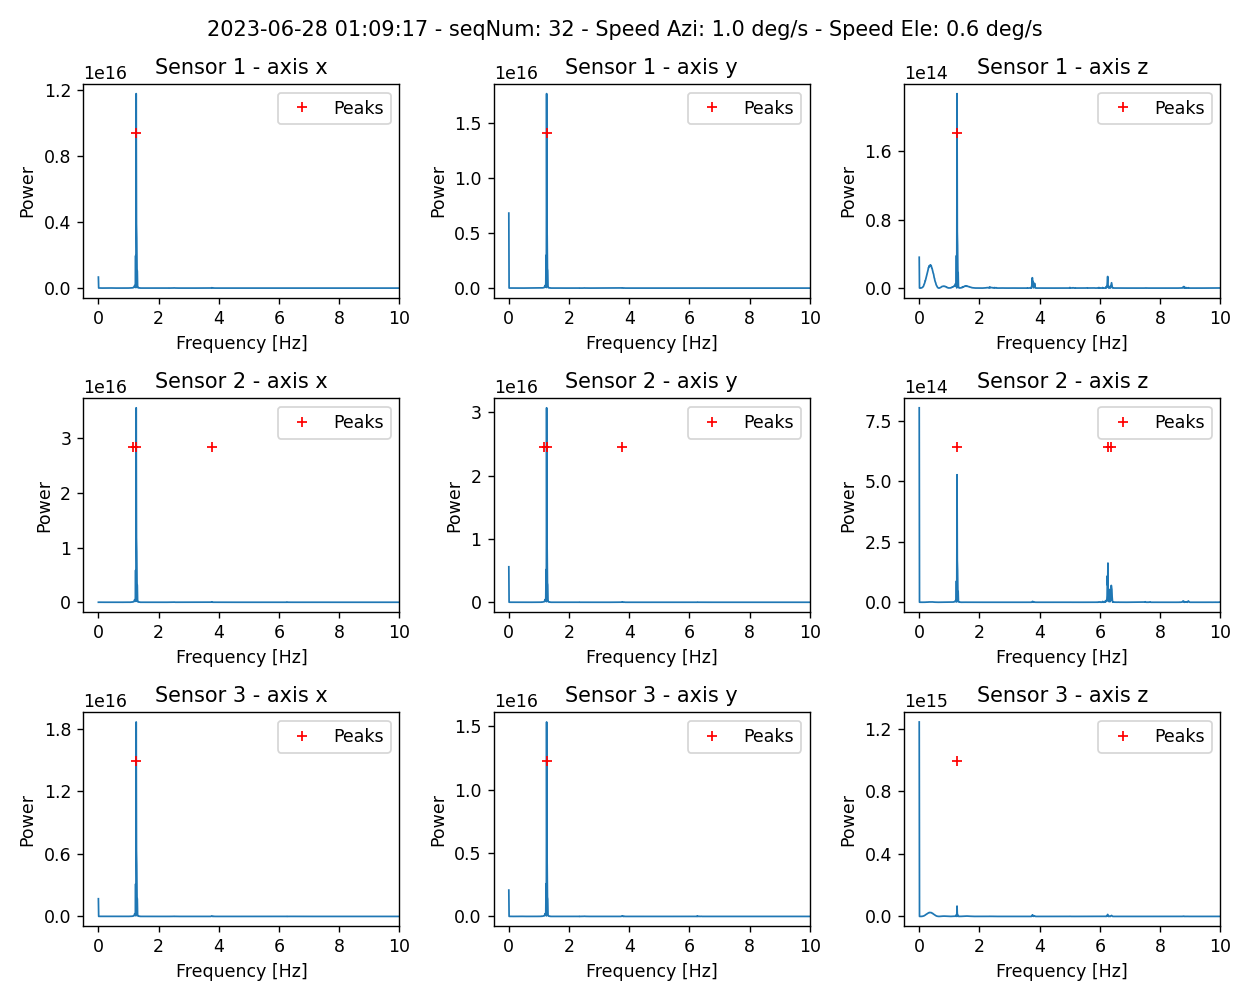
Fig. 18 Fourier analysis of the signal recorded by the 3 VMS accelerometers (3 axes). The crosses indicate the location of the detected peaks in frenquency#
Conclusion on the strong vibration event recorded on June 28th, 2023#
From the detailed analysis of this strong vibration event we conclude that the frequency of the vibration recorded by all the VMS channel is 1.26 Hz. The TMA Torque in elevation is very high, oscillating beween -200.000 and +200,000 N.m while the vibrations seen by M1M3 generate a maximum force of +/-500 N, far from the breakaway threshold.
Two actions have been taken in order to correct the behavior of the TMA:
The force balance system is disabled during slews
The filtering implemented in the TMA control loop has been modified to avoid any re-occurence of this kind of vibration event.
Conclusion#
In this Technical Note, we have described a detailed investigation of two events where strong vibrations were detected by the VMS system in correlation with other sensors. We have developped the tools (notebooks) to identify and analyse these events and they are ready to be re-used during the next campaign of measurements with the glass mirrors. Unfortunately it was not possible to identify the exact source of these vibrations as the analysis was performed while the cell + surrogate mirror were dismounted. Using these notebooks during the future tests of the TMA will probably allow to identify potential problems and to react quickly.